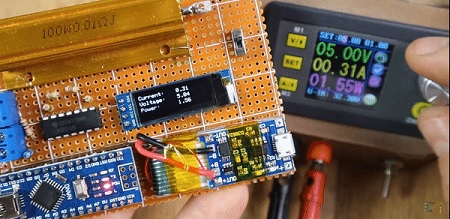
As mentioned in the article describing the construction of the 8362 Power Meter, it would be convenient to have the meter connected to a microprocessor so that conversion of the voltage reading to dBm was done automatically. This was the motivation for the construction of the Data Logger.
The basic Data Logger is a 16-bit voltmeter. In the article describing the calibration and testing of the Power Meter, a table and graph were provided that described the relation between the experimentally determined voltage and dBm. The data was reduced to a single equation Volts = slope*dBm + intercept or more specifically Volts = 0.051*dBm + 3.06. In reverse, dBm = (Volts-3.06)/0.051.
It is important to make sure that the voltage measurements, if measured by another instrument are, in fact, the same as those obtained with the data logger. The data logger has a 16-bit A to D with > 10 megaohm input impedance. This is typical of most digital voltmeters. To reduce the possibility of errors, the software shown below provides both the voltage measured and the power calculated. In practice, the data logger is calibrated using the voltage measurements over a range of frequencies and power attenuation. Once the voltages are obtained, a few minutes with an Excel spreadsheet will provide a slope and intercept that can be applied to the conversion as above. Once calibrated, the voltages are not needed but they are an added safety feature that tells the user that everything is operating as expected, especially when unexpected power reading are obtained.
Since most of the features of the Data Logger code are not needed for the majority of applications of the Power Meter, a large part of the code was removed to the bare-bones voltmeter. Finally, the equation developed in the above paragraph was added and results shown below.
#include <Adafruit_ADS1X15.h>
#include <ADS1X15.h>
#include <Ethernet.h>
#include <LiquidCrystal.h>
LiquidCrystal lcd(7, 8, 9, 10, 2, 3);
#include <Wire.h>
Adafruit_ADS1X15 ads1115;
const float multiplier = 0.000125F;
void setup(void)
{
lcd.begin(16, 2);
Serial.begin(9600);
ads1115.setGain(GAIN_ONE);
ads1115.begin();
}
void loop(void)
{
int16_t adc0;
float dBm;
float (volts);
adc0 = ads1115.readADC_SingleEnded(0);
volts = adc0 * multiplier;
dBm = ((adc0 * multiplier)-3.06)/.051;
//calibration numbers from 10-12/2022
lcd.setCursor(4,0);
lcd.print(dBm);
lcd.setCursor(10,0);
lcd.print(” dBm”);
lcd.setCursor(4,1);
lcd.print(volts,4);
lcd.setCursor(10,1);
lcd.print(” V “);
Serial.print(dBm);
Serial.println(” dBm”);
Serial.print(volts,4);
Serial.println(” V”);
delay(50);
}
Does it work as expected?
Before moving on to applications a few simple tests were performed.
- Connected to RF Generator described under Microwave Sources, full power, 500 MHz
- Reading = -0.44dBm very close to 1 milliwatt as expected.
- Reduced full power by one division
- Reading = -3.4 dBm exactly as expected, a 3 dB reduction
- Full power with 6 dB attenuator
- Reading = -6.4 dBm
- Full power with 30 dB attenuator
- Reading = -30.6 dBm
- Full power, with 30 dB attenuator 150 MHz
- Reading = -31.0 dBm
Conclusion: Device is operating as good as expected. Note: Given that a well-defined standard power source was not used for calibration, it would be appropriately conservative not to interpret the decimal places as overly significant. However, since precision attenuators were used for the calibration, differences in power are probably good to at least one decimal place and adequate for most applications. An example is provided below.
A Real Measurement: Power Loss in RG58 Coaxial Cable
A 100 ft piece of RG58 cable was chosen for these measurements since it was available from another experiment. The measurement was very simple. First, the Power Meter was connected to the RF Generator, full power at 150 MHz with a very short piece of coaxial cable (18”). The power reading was -0.83 dBm. Note: this required the use of two SMA to BNC adapters. Finally, the 100 ft piece was inserted between the source and the meter. The power reading was -7.4 dBm. The net loss was -6.6 dB. A quick look on the internet gave one estimate of -5.6 dB at 150 MHz.
The basic experiment was duplicated at 10 MHz (30 meter amateur radio band) using an HP8640B Signal Generator with the output set to -30 dbm. The net loss was -1.1 dB, again consistent values found on the internet.
In typical microwave experiments, loss and gain are measured in dB’s. A bit of algebra will show that dB is the correct unit since the baseline powers, 1 watt or 1 mwatt, drop out of the equation leaving:
∆dB=10log(P_f⁄P_i )
Since this is a ratio of powers the units (watts or milliwatts) do not matter.
Note: This example focuses on the 8362 based power meter. Everything is generally the same for the 8318 based power meter except that the slope and intercept of the calibration equation are different. In the authors meter, the slope was -0.0273 and the intercept was 0.528. When using this meter be mindful of the sign of the slope.
