When the Amateur Scientist columns were written data loggers did not exist. Data was either collected manually or via a chart recorder. The advent of the data logger created an opportunity to do measurements over extended periods of time with ease. This capability has given scientists, both professional and amateur, the ability to study an incredible scope of natural processes that would have been much too tedious to consider otherwise. Consider the following: a metal object laying in the sun gets very hot but how hot and how fast. Such a question may be dismissed immediately because of time required and the fact that the question is somewhat ordinary. With a data logger capable of measuring temperature, choosing a good location may be the most difficult aspect of the project. Look around, think, and uses for a data logger jump out to the amateur.
The author has a specific example of an application that is based on an intriguing question actually discussed in Scientific American as a feature article. The example is based on the “wives’ tale” that hot water freezes faster than cold water, i.e. filling an ice cube tray with hot water versus cold water. This, obviously, was before refrigerators were routinely equipped with ice makers. Debunking a wives’ tale usually starts with collecting valid data under controlled conditions. Preliminary experiments indicated that there was in fact some validity to the tale. In comes the data logger, set up some ice cube trays in a freezer and monitor the temperature and check periodically for freezing. A very easy experiment to do once a data logger is available. Unlike Paul Harvey’s stories, “the rest of the story” will remain untold and left as an experiment to the curious. As expected, the data does tell “the rest of the story” and a lot about water freezing.
A rather remarkable data logger can be built with an Arduino or a variety of other microcontrollers without much difficulty. The author made use of a simple Arduino Uno, a data logger shield from Adafruit, a 16-bit A to D ADS1115, and an LCD display. A box, some connectors and a little imagination is all that remains.
The Arduino Data Logger shield is designed to plug directly on top of the Uno and it contains an SD card socket with associated interface and a real-time clock with associate interface. SD cards have huge capacities, 32 GB in the current example and the clock is accurate to a few seconds a year. Both are way beyond expected needs. The 16 bit A to D uses I2C serial interface and only a few wires are required to connect to the Arduino. This chip provides programmable gain and 4 independent analog inputs and has an internal voltage reference. Again, much much more than required for almost all applications. The original target for the device started as a simple voltmeter capable of converting volts to dBm from the microwave power meters described in other sections of this webpage. Since a voltmeter can be connected to a variety of sensors it seemed reasonable to expand the capabilities since the increase in cost and construction effort was very small.
The Box
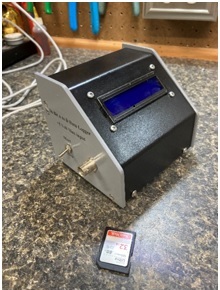
Obvious, any box will do, and the readers imagination will lead them as needed. The author, however, had a few design requirements in mind. First, a reasonably large LCD display, placed on a slanted panel to make everything easy to read. In the back of the box, a slot was left to allow access to the USB connector, power input, reset switch and SD socket. The box was be designed to sit on top of a small 12 v lead acid battery for extended operating times when needed. The top panel contained only the LCD display but no connectors or switches, so that it could be easily removed, and modifications made as needed. This is critically important because some tweaking will be required, eventually. One BNC connectors and one SPST switch were mounted on one of the side-panel. The base plate was made with ¼” thick aluminum to provide stability.

Electronics
Arduino Uno. The Arduino Uno was mounted on the bottom plate centered but flush with the back of the plate. This allowed for easy access to the USB connector, power connector, reset switch and SD card socket. The Uno has four mounting wholes but only three have enough clearance to allow screws for mounting. A piece of insulating plastic was place under the Uno to prevent shorts to the bottom of the board which has exposed solder joints.
Data-Logger Shield. The data logger shield plugs directly on top of the Uno once the pins supplied with the shield are soldered in place. The pins provide electrical path to the Uno and allow connection to the Uno with the same pin layout as the Uno. Only one modification of the shield board was required in this design. The ChipSelect line is hard wired to pin 10 which is used by the LCD display. The board is designed to allow this to be changed. The default was removed by cutting a trace and a jumper wire was soldered to pin 6. This must be changed in the software as well.
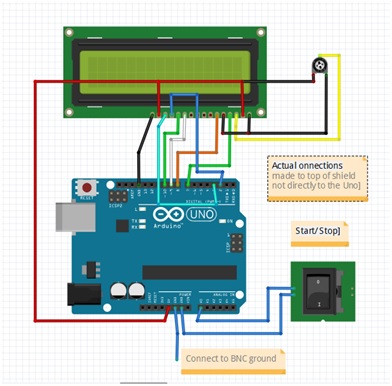
LCD Display. The LCD display was attached to the shield using short wires soldered to header pins similar the those used to connect the shield to the Uno. In the absence of the shield the 8 lines to the LCD can be plugged into almost any of the I/O pins on the Uno. However, the shield and clock use several pins and conflicts need to be avoided. In the present design pins 7, 8, 9, 10, 2, 3 on the Uno are used in addition to +5v and ground (these must be selected in the software as well). These are connected to 4, 6, 10, 11, 12, 13 on the LCD respectively as shown in the fritzing diagram below. Pin 15 on the LCD goes to +5 V and pin 16 goes to ground.
The LCD connections were made on a large male header so that the entire header could be easily connected to the Uno in the correct orientation. This worked to a point. Pins 2 and 3 had to be separated as did the connection +5 V. The design of the connector is an important consideration since the display will need to be removed many times during the inevitable debugging process. The Adafruit tutorial can be very helpful in getting the LCD to work but keep in mind that the pins used in the tutorial are different from the ones needed in the data logger because of pin conflicts. Getting the LCD to work before adding anything else can be a great time saver. It should run “Hello World” in the Arduino IDE.
The LCD has a backlight potentiometer, and this was just connected to the LCD display as directed in the Adafruit tutorial (potentiometer pin 1 to ground, pin 2 to +5 v and center to pin 3 on the LCD display) The potentiometer is small and light so it was left to dangle on some short leads. No external access was provided since once it was set no further adjustments is necessary.

Analog to Digital Converter. The Arduino has several 10-bit A to D inputs that can be used very easily. However, in the current design, a 16-bit A to D converter based on the ADS1115 was used. A small PC board containing the ADS1115 with the basic support hardware is available from AdaFruit and other vendors. Besides the enhanced resolution, the ADS1115 has 4 analog inputs, programmable gain as well as an internal voltage reference. The AdaFruit web site provides an excellent tutorial on its use with the Arduino Uno (and other microprocessors) as well as example software, and links to libraries not found in the Arduino IDE. The libraries AdaFruit ADS1X15.h and ADS1X15.h are critical to the function of the device and need to be added to the libraries in the Arduino IDE.
The ADS1115 requires only power, ground and two control lines to function. It is member of a family of integrated circuits that use I2C protocol to communicate with microprocessors. The specific lines are SDL and SQL and are already available and labelled as such on the Arduino Uno and these extend through the shield which is also labeled. The author made use of the breadboard area on the shield and soldered an appropriate style header a few rows back from center. The header allows the ADS1115 board to be easily removed in case it has to be replaced. The breadboard area has a +5 v and ground bus and this was include in the header connection. Conveniently, pins 1 and 2 on the ADS1115 board line up with the bus. Some short pieces of wire were required to connect to SDL and SQL on the underside of the shield board. An addition short piece of header was added to provide a place to plug in the analog input (again convenience during work up). Input A0 on the ADS1115 was used in the current design. The addr line was grounded to set the address of the ADS1115 to 0x48.
Start/Stop Recording. A simple SPST switch was added to the data logger and it starts and stops the recording. The circuitry is very simple. One terminal is connected to ground and the other is connected to pin A0. The software adds a pull-up resistor to the input of A0. Thus in one position the Arduino sees A0 as high or 1 and in the other the A0 appears as low or 0. An “if” statement triggers the recording when A0 goes high. The LCD continues to monitor the voltage regardless so that the experiment can be set up before recording starts. The serial monitor works like the SD and stops if A0 is set low.
Software
Typical of software for the Arduino, this is a collection of snips from a variety of sources held together with some original code. The software for the basic voltmeter and logger is small enough for copy and past into the Arduino IDE. Modifications of the code for specific applications will appear in other posting on this website. The “Serial.print” statements were added for ease in debugging.
The file stored on the SD is in Txt format. CSV format is a better choice. Excel will recognize the form of the dataset and show a table with possible delimiters, chose “comma” and finish. Save the file as CSV. If Excel does not recognize the file the conversion can be done as follows if the file is not too large.. Once the file is loaded into Excel, select Data on the upper tool bar and then select “Column to Text” on the tool bar (right side). Select comma as the split point and this will move the data into two columns which can then be saves as a CSV file (or plotted or …).
The time is recorded with semicolons for the same reason. You may also wish to convert the time to a different format, for example, if the file covers several hours, convert to hours and decimal places for the minutes and second ( hours + minutes/60 + seconds/3600 ). The time will look like 11.35623. Use the “Column to Text” tool but this time choose “semi-column” to separate hours from minutes and seconds (3 columns).
#include <EEPROM.h>
#include <Adafruit_ADS1X15.h>
#include “RTClib.h”
#include <Ethernet.h>
#include <LiquidCrystal.h>
#include <SPI.h>
#include <SD.h>
Adafruit_ADS1X15 ads1115;
RTC_PCF8523 rtc;
LiquidCrystal lcd(7, 8, 9, 10, 2, 3);
const int chipSelect = 6;
const float multiplier = 0.000125F;
float DataOut;
void setup() {
// Open serial communications and wait for port to open:
Serial.begin(9600);
while (!Serial) {
; // wait for serial port to connect. Needed for native USB port only
}
Serial.print(“Initializing SD card…”);
// see if the card is present and can be initialized:
if (!SD.begin(chipSelect)) {
Serial.println(“Card failed, or not present”);
// don’t do anything more:
while (1);
}
Serial.println(“card initialized.”);
pinMode(A0, INPUT_PULLUP);
lcd.begin(16, 2);
ads1115.setGain(GAIN_ONE);
#ifndef ESP8266
while (!Serial); // wait for serial port to connect. Needed for native USB
#endif
rtc.begin();
ads1115.begin();
}
void loop () {
String dataString = “”;
int SDstart = 0;
//Check the Record flag
SDstart = digitalRead(A0);
float adc0;
adc0 = ads1115.readADC_SingleEnded(0);
lcd.setCursor(0, 0);
DataOut = adc0 * multiplier;
// Other modification of the voltage can be added here
// For example converting Volts to temperature, DataOut = adc0 * multiplier * TempConvert
// Where TempConvert is a variable used to convert volts to temperature.
lcd.print(DataOut, 4);
// this line names the data that will be sent to the SD card
dataString = String(DataOut,4);
DateTime now = rtc.now();
lcd.setCursor(0, 1);
String Shour;
String Sminute;
String Ssecond;
String Stime;
Shour = String(now.hour());
Sminute = String(now.minute());
Ssecond = String(now.second());
Stime = (Shour + “;” + Sminute + “;” + Ssecond);
lcd.print(Stime);
if (SDstart == 1) {
lcd.print(” Record”);
}
if (SDstart == 0) {
lcd.print(” “);
}
File dataFile = SD.open(“datalog.txt”, FILE_WRITE);
if (SDstart == 1) {
dataFile.print(dataString);
dataFile.print(“, “);
dataFile.println(Stime);
Serial.print(DataOut,4);
Serial.print(“, “);
Serial.println(Stime);
}
dataFile.close();
// delay 5000 is 5 sec
delay(100); }
This program will stop if there is no SD card. If this happens insert the card and press the reset button on the Uno. In the author’s construction there is just enough room to reach the reset button from the slot in the back.
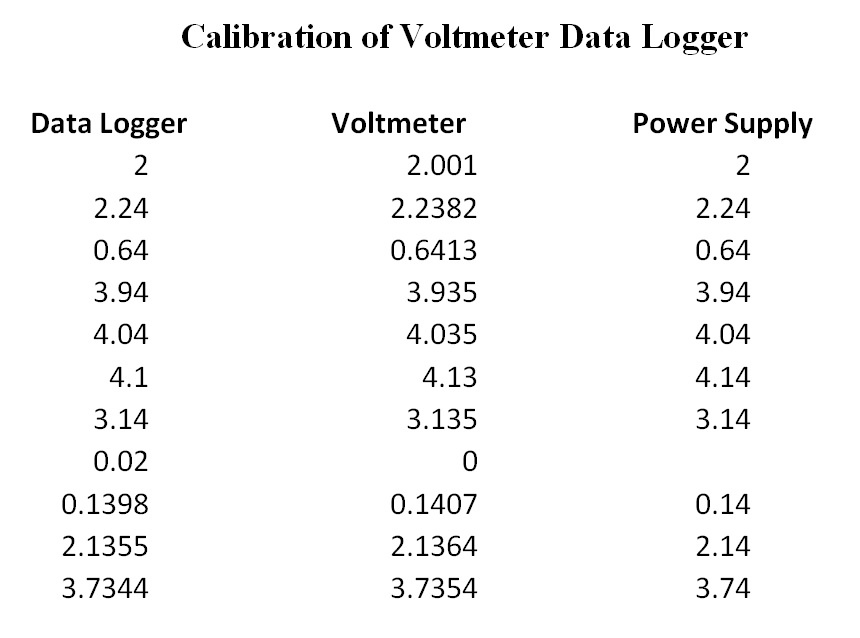
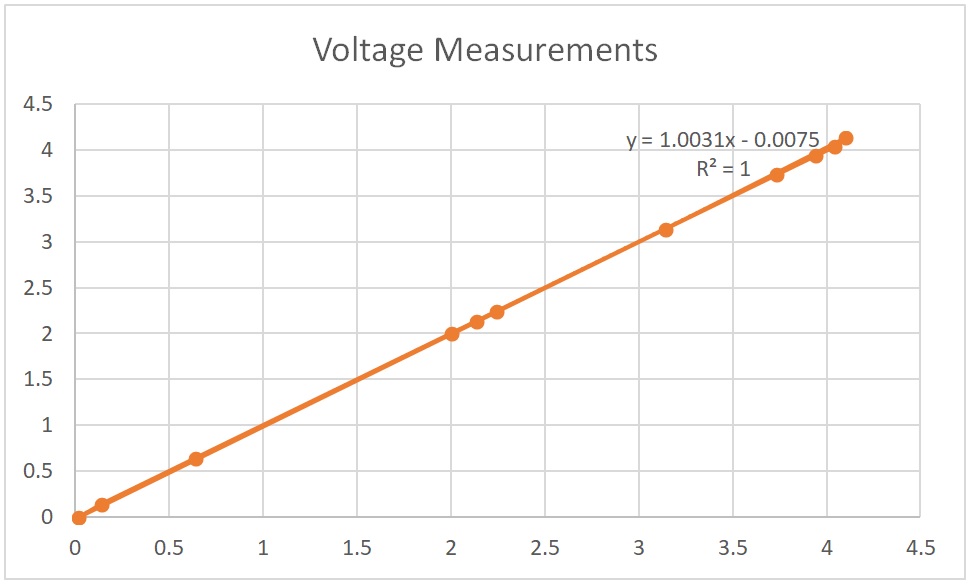
Calibration of Voltmeter Data Logger. To check how well the voltmeter was working, a simple comparison of reading from an Owen XDN 1041multimeter, the digital readout from the voltage source and the data logger were made. The data is shown below. The Data Logger readings with two decimal places were taken with the default print command which provides only two decimal places. The readings near the bottom of the table were taken with the print command modified to provide 4 decimal places. The x-axis of the graph is the data logger readings and the y-axis in readings from the Owen multimeter.
Overall, the agreement is excellent, a testament to the quality of the ADS1115. The average difference between the Data Logger and multimeter measurements is 0.007 volts. The data does reveal an upper limit of just over 4 volts. Keep in mind that this can easily be extended with voltage dividers or selecting higher gain in the ADS1115.

