Now that a microwave source and a power meter is at hand it is time to do some experiments. Perhaps the best place to start at the data sheet. The data sheet will provide the proper expectations and give some sense of overall performance. Please note that although this writing focuses on the AD8362 based power meter all of the comments apply to the AD8313 based power meter.
Two key features are evident from the datasheet. The power meter should show a 50 mV/dB dependence on power. The uncertainty on the data sheet is about 1 mV/dB. The power meter should show near zero volts at -60 dB (called intercept).
There is a point of potential confusion in these statements since the units are in terms of dB’s and the sources can only provide a milliwatt or less. Everywhere on the data sheet dB means 10log(P2/P1). In other words, we are not referencing to 1 watt anywhere. In this equation, the units of P2 and P1 can be anything since the units will cancel in the equation. So dBm is fine, even though is it referenced to 1 milliwatt, since the equation only uses a ratio. This is all a matter convenience for the engineers.
If we start with the microwave source at full power (we don’t know what that is yet and we don’t need to) we can measure the power dependence by simply reducing the power in a know manner. We need to “attenuate” the power. There are a number of commercial devices to do this but since we are working in the microwave domain some care must be taken not to introduce losses due to stray capacitance and inductance. Fortunately, it is possible to buy very simple attenuators such as those shown in Figure 4.2.
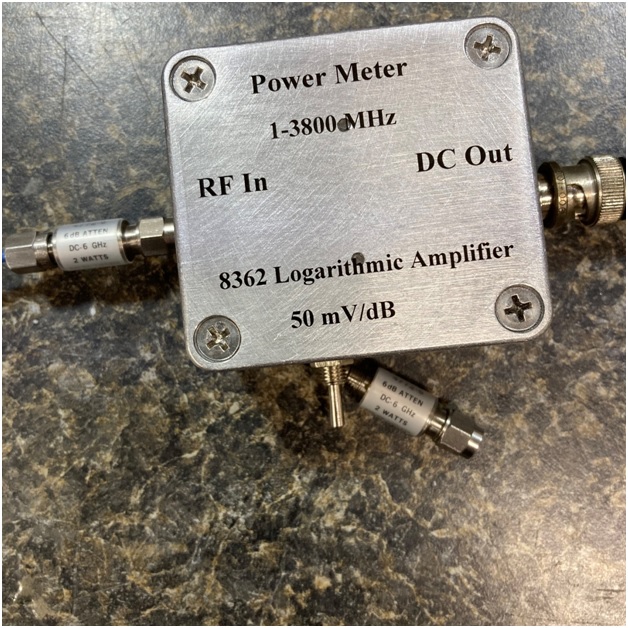
Figure 4.1. Close up of testing a calibration setup showing details of attenuators.
Each of these is precisely constructed with a known attenuation over a well-defined frequency range and they are labeled with that information (as evident in the figure). These can be expensive, but it is also possible to find some at very good prices at hamfests. A series of 5 covering the range 5-30 will be enough for most experiments since they can be strung together to make larger values. The author has 6, 20 and 30 dB attenuators in pairs.
There is one other feature of the spreadsheet that may cause some confusion. Various places discuss “intercepts”. Unfortunately, the authors do not distinguish between Y-intercepts (familiar from algebra) and X-intercepts. For example, in the table of specifications the X-intercept is just called intercept. Yet this parameter is critically important. It this the value of power required to give an output of zero volts, somewhere around 60 dBm in the present case. The Y-intercept is not as important, although, it provides the means of calculating the X-intercept (Y-intercept/slope, in other words solving the equation of a straight line when y = 0)
Actual Measurements
So as not to spoil all the fun, only a single set of measurements will be discussed. The setup is simple and included the SynthUSB source, the AD8362 power meter, a voltmeter, attenuators and coaxial cable for the connections (Figures 4.1 and 4.2). All are solid connections, no alligator clips, BNC and SMA only.
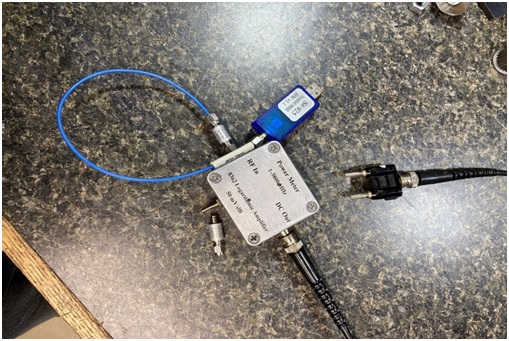
Figure 4.2. Basic connections for Power Meter Testing and Calibration
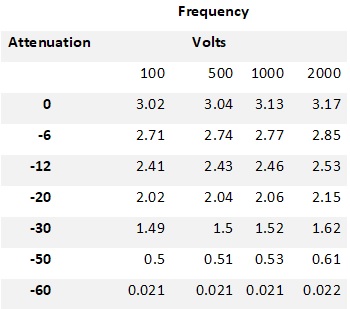
Four frequencies were chosen 100, 500, 1500 and 2000 MHz. Some other measurements were done 900, 1900 and 2200 MHz, to duplicate the data sheet.
The raw data was collected in a notebook and then transferred to Excel. The attenuation used is in the first column, then the output voltages from the power meter at each frequency.
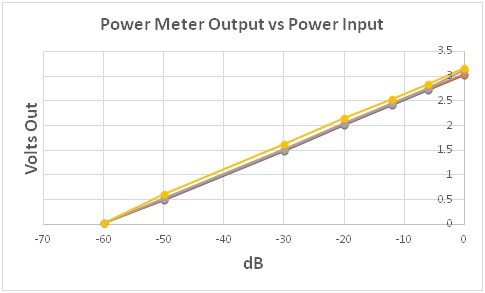
The data was graphed and slopes and Y-intercepts were obtained by using Trendline for each frequency. Trendline gives the equation for the line that best fits the data. The R2 factor was also recorded as a measure of the quality of the fit to the line. As expected all plots showed R2 > 0.999. For those not conversant in statistics, the R2 value is one of the parameters given with Trendline. The maximum is 1.0 for a perfect fit, 0.99 is typical of data which appear to fall fit the line.
Finally, the slopes and intercepts (X and Y) were tabulated from the Trendline equations, averaged and compared to the values given in the data sheet.
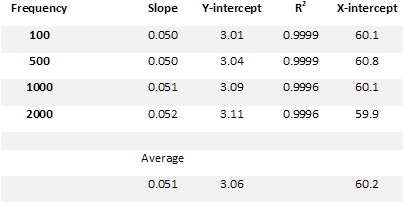
Datasheet Values 0.050 60
As can be seen the actual power meters perform essentially the same as reported for typical chips in the data sheet. The slopes as expected are independent of frequency unless one considers the slight increase with increasing frequency as significant. It is not significant for the intended applications.
A very important feature is the X-intercept and the agreement with the datasheet. This would only happen if the full power source output was 1 milliwatt or 0 dBm. If the power was higher the X-intercept would have been shifted to lower dBm and the opposite true if it were smaller. Thus, because of a little luck, we now have an absolute measure of power rather than a relative measure without the need for finding a calibrated source. Although important the user will discover that fortunately the absolute power is rarely needed. If the reader has ever used a low frequency RF generator he or she will know that only very expensive models provide information about the RF output power and rarely, is it even considered. In a typical experiment, most users just need some RF.
Obviously, the power meters are great just as they are, but they will require some kind of look-up table to convert from volts to dB’s or dBm’s depending on the application. The experimenter in me is wondering about maybe attaching an Arduino with a digital display. Let the Arduino take the equations and calculate the dBm’s or changes in dB’s and display them on an LCD display.
In case you are dubious about the coincidental fit to 1 milliwatt, another experiment was performed. In this last experiment, another signal source was used (HP8640B, 50 ohm output impedance) and the amplitude of the signal was measured with an oscilloscope (50 ohm input impedance) as RMS volts at 100 MHz (near the limit of the scope). The output was varied and in each case the voltage output from the power meter was in agreement with that expected with an overall error of less than 3%.
Warning: These amplifiers only work properly when very lightly loaded. Specifically, a voltmeter with a 10 megaohm or greater input impedance will give satisfactory results very similar to that indicated on the datasheet.
