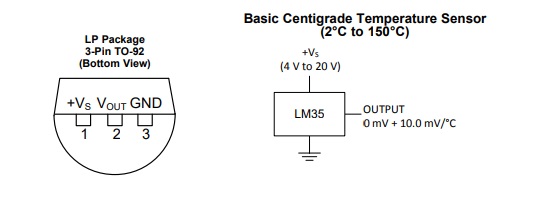
Some of the simplest temperature sensors that can be used with the Data Logger are the LM35 and other members of the family. The LM35 is a three-terminal device in a TO-92 package and it is very inexpensive. Connections are straight forward, one to ground, one to V+ and one for temperature out. The LM35 is designed to operate in the Celsius mode and provides +10 mV per degree, 0 volts at 0oC and 1000 mV or 1 volt at 100oC. The operating range is -55oC to 150oC with a supply voltage of 4-30 V. The circuitry is a bit more complicated for temperatures below 0oC but in this article we will work above 0oC. Examples are given in the datasheet which is readily available on the internet. The LM34 operates in the Fahrenheit mode and the LM335 operates in the Kelvin mode.

Figure 1. Pin-out for LM35 sensor.
The Data Logger has only a two terminal BNC connector for input. To accommodate the BNC connection and avoid acquiring shielded 3 conductor cable, a very small intermediate box was used. The box holds the battery (9 V) and an on-off switch. A BNC connector is provided for connection via a length of coaxial cable (RG58 is fine) to the Data Logger and the sensor is connected to a 4 terminal audio connector (available from previous projects) via a 4-5 ft piece of shielded 3-conductor wire (one conductor is the shield). The operating current of the LM35 is less than 60 uA so battery life should not be an issue. One hundred feet of RG58 was tried and only a few millivolts was observed.
Some attention needs to be paid to the connections to the sensor and the connection of the sensor to whatever subject of the temperature measurements. The author built two assemblies. In the first, the LM35 was soldered to the 3-conductor cable, heat shrink tubing was applied to each connection and finally the entire assembly was epoxied inside a 12” piece of thin wall brass tubing (0.25” O.D.). The sensor was flush with one end but had a protective layer of epoxy exposed. The other end of the tubing was covered with heat shrink tubing. Thus, the assembly could be emmersed in water or some other fluid. In the second, the wires were soldered, covered with heat shrink, and nothing further done.
When constructing this piece for a temperature measuring experiment care must be given to the heat capacity of the finished assembly. Everything touching the sensor must reach the temperature of the system under investigation. Therefore, the amount of heat required to heat the sensor and any kind of holder, in theory, should be very close to zero. In practice, the heat should be kept to a minimum. In the above arrangement, thin-wall brass tubing was chosen. Brass has a relatively low heat capacity (heat required to raise its temperature and the overall mass used was very small (again little heat required).
When designing the holder, a proper prospective should be maintained. If the heat of the system under investigation is large and the experiment is done over a long period of time almost any arrangement will work. If on the other hand, an investigator is interested in measuring the temperature of a fly some serious attention will have to be paid to the experimental set up.
Software Considerations
The software, described for the Data Logger in the earlier section, requires only a few changes for this application.
#include <Adafruit_ADS1X15.h>
#include <ADS1X15.h>
#include “RTClib.h”
#include <Ethernet.h>
#include <LiquidCrystal.h>
#include <SPI.h>
#include <SD.h>
LiquidCrystal lcd(7, 8, 9, 10, 2, 3);
const int chipSelect = 6;
RTC_PCF8523 rtc;
Adafruit_ADS1X15 ads1115;
const float multiplier = 0.0125F;
void setup() {
Serial.begin(9600);
Serial.print(“Initializing SD card…”);
if (!SD.begin(chipSelect)) {
Serial.println(“Card failed, or not present”);
while (1);
}
Serial.println(“card initialized.”);
//}
pinMode(A0, INPUT_PULLUP);
lcd.begin(16, 2);
ads1115.setGain(GAIN_ONE);
#ifndef ESP8266
while (!Serial); // wait for serial port to connect. Needed for native USB
#endif
rtc.begin();
ads1115.begin();
}
void loop () {
String dataString = “”;
int SDstart = 0;
SDstart = digitalRead(A0);
int16_t adc0;
float TempC;
float TempF;
float DataOut;
adc0 = ads1115.readADC_SingleEnded(0);
lcd.setCursor(0, 0);
//TempC = (adc0 * multiplier);
TempC = ((adc0 * multiplier – 1.3537)/1.0578);
TempF = 32 + TempC * 9 / 5;
DataOut = TempC;
dataString = String(DataOut);
lcd.print(TempC);
lcd.setCursor (6, 0);
lcd.print(“C”);
lcd.setCursor(8, 0);
lcd.print(TempF);
lcd.setCursor(14, 0);
lcd.print(“F”);
DateTime now = rtc.now();
lcd.setCursor(0, 1);
String Shour;
String Sminute;
String Ssecond;
String Stime;
Shour = String(now.hour());
Sminute = String(now.minute());
Ssecond = String(now.second());
Stime = (Shour + “;” + Sminute + “;” + Ssecond);
lcd.print(Stime);
if (SDstart == 1) {
lcd.print(” Record”);
}
if (SDstart == 0) {
lcd.print(” “);
}
File dataFile = SD.open(“datalog.txt”, FILE_WRITE);
if (SDstart == 1) {
dataFile.print(dataString);
dataFile.print(“, “);
dataFile.println(Stime);
Serial.print(dataString);
Serial.print(“, “);
Serial.println(Stime);
}
dataFile.close();
// delay 5000 is 5 sec
delay(100);
}
Calibration
The datasheet indicates that the LM35 is good to within 1o over its range. However, measurements of the LM35’s used in these experiments indicated a larger departure. This was first noted with the temperature sensors connected to the Data Logger. Some voltage measurements directly at the LM35 indicted that the problem was the LM35 and not the Data Logger amplifiers. Although inconvenient this is not a major problem and can be remedied with some calibration measurements. In fact, in most scientific studies, calibration of the thermometers would be common practice, depending somewhat on the accuracy needed in the experiments. A quick scan of glass laboratory thermometer will reveal that the temperature measurement if typically +/- 2oC
During the calibration procedure, the battery that powers the LM35 was changed as a precautionary measure. The original had declined to 7.2 V and the new one was 9.6 V. Only 0.1oC difference was noted before and after the battery change and so the precaution was unnecessary.
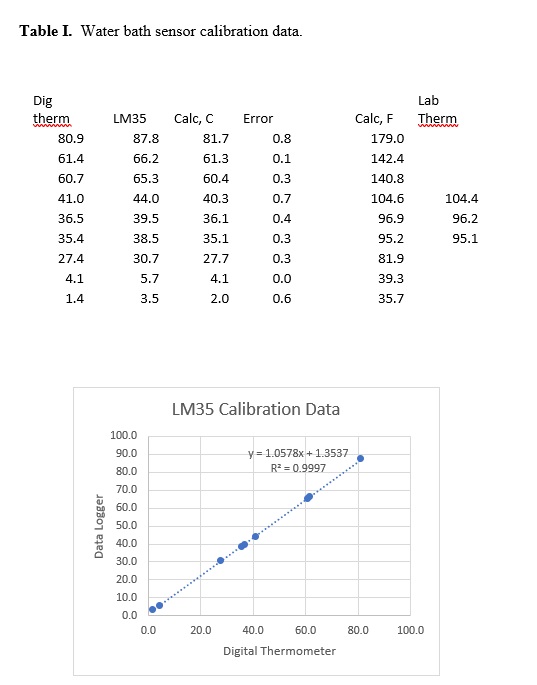
The temperature sensor was calibrated by immersing in a thermostated beaker of water along with other temperature measuring devices. These included a digital thermometer and a glass laboratory thermometer (Fahrenheit). The results are given in the table below. The columns “Calc, C” and “Calc, F” are calculated based on corrections described in the next paragraph.

The software contains two lines of code which determine the temperature on the display. The “// “or comment was used to turn one line or the other on or off. The first is “//TempC = (adc0 * multiplier);” which gave the temperature in Centigrade using calibration data from the LM35 datasheet, specifically, a change of 0.010 mV per degree and 0.0 volts at 0oC. This line (// removed) was used to collect the data shown in Table I.
The graph shows a plot of the temperature values obtained with the digital thermometer versus the temperature indicated by the Data Logger (labeled LM35) with the datasheet calibration. The graph actually shows the difference between the digital thermometer and the Data Logger. Surprisingly, the differences are linear and thus make corrections very simple. The trendline indicates that the slope is slightly off as is the intercept. The following line, “TempC = ((adc0 * multiplier – 1.3537)/1.0578);” shows how the corrections are made. The numbers were obtained from the trendline equation included in the graph. The errors after calibration are included in the table and indicate an average error of about 0.5oC which is very acceptable for most experiments. Note: In the software above, this line is active and original is shut off with the //.
Experiment #1. How hot does a piece of metal laying in the sun get?
This question came up during construction of an 80 M antenna. During this project, the mast and some of the tools got so hot they were impossible to handle without gloves (hot clear summer day).
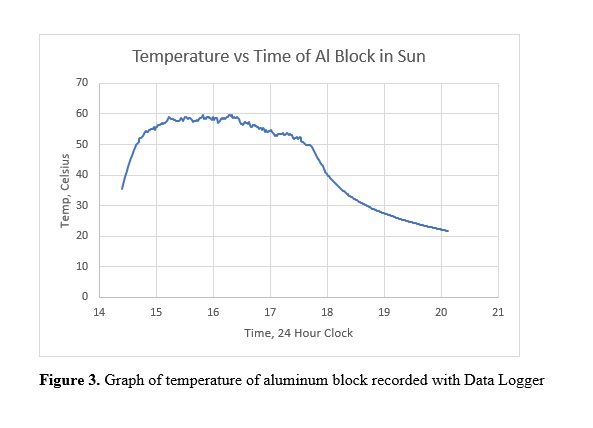
To get some of understanding of this heating process, the LM35 was clamped to a 8.91 x 15.9 x 1.91 cm block of aluminum which was painted flat black. The block was placed about 3 ft above the ground, tilted at about 25o and set on painting pyramids so that it was very lightly touching the wooden surface it rested on. The Data Logger was set to record once every minute and left for several hours. The ambient temperature at 16:20 was 81oF or 27.2oC.

The results are a bit surprising. The maximum temperature of the block occurred around 16:00 in the afternoon and was 59.59oC or 139.3oF. At this temperature the block was too hot to hold in a bare hand.
The data also shows what appears to be noise in the temperature reading. Is this true noise indicating a problem with the sensor or is it real? This question is easy to answer. Observations during construction showed a very steady temperature on the bench (fix ambient temperature and no wind). On the bench over a period of 3 minutes, collecting every 5 seconds, the temperature variety between 24.98 and 24.99. Experiments at other temperatures gave the same results, no significant noise at temperatures of the experiment. The fluctuations are real and consistent with the sensitivity observed on the bench. Just touching the block briefly results in a change in temperature. Further experiments designed to test the calibration confirmed.
What is the source of the fluctuations? There were no clouds on the day of the experiment but there were occasional small wind gusts. A change in air flow over the block could explain the fluctuations.
Is this Experimental Setup Capable Measuring the Solar Flux?
The block and sensor constitute a bolometer, a device used to measure the intensity of incident irradiation. The block is aluminum which has a specific heat capacity of 0.89 J/goC. Its volume is 270 cm3 and its mass is 730 g (calculated and measured). The total heat capacity is 730 x 0.89 or 650 J/oC which means it takes 650 joules or 155 calories to raise the temperature of the block one degree.
Starting the block at 42.5oC and putting it in the same location as other experiments showed a near linear increase in temperature of about 43oC/hour (only recorded for 15 minutes). Given a heat capacity of 650 J/oC, 43oC/hour yields 28000 Joules/hour. The rate of temperature increase is a combination of the heat input from the sun and heat loss by contact with the cooler air. Figure 3 indicates that the temperature increase reaches a maximum and then decreases as the sun set. The existence of maximum is an indication that there is a equilibrium between heat input and heat loss. Over the short period of midday the heat input does not change much. The rate of heat loss depends on the difference between the block and the surrounding air. If the difference is small the heat loss in small, thus at the start of the experiment a rate of 43oC/hour is probably close to the solar input.
Solar flux is generally given in terms of watts/m2. 1 watt = 1 joule/sec. In the present case 28000/3600 = 7.8 watts per 0.0142 m2 or 548 watts/m2. However, when the block reaches equilibrium, this input is balanced by an equal heat loss. Thus, the solar flux is 548 x 2 or about 1 kW/m2 consistent with reported values.
